Tags:
If you have a lot of data that you need to convey to your audience you could use a table, but a graph or chart can help convey the same information much more simply and quickly to your readers. However, we need to be careful that the graphs that we create are still available to our whole audience. There are some simple ways that we can ensure this.
Contents
Text Alternatives
It's very common for charts to be included on a page with a standard <img> tag, but there are a few different ways to add a text alternative to it.
Alt Text
Adding an alt attribute to the image is the main way to make an image more accessible. Not only is that text available to screen readers, but users on a slow connection will see that text before the image loads in.
Good alt text should be a replacement for the image it belongs to. This might be a description of what the image shows, or it could be the literal text in an image. Consider this example of a graph indicating a persons primary colour preference:
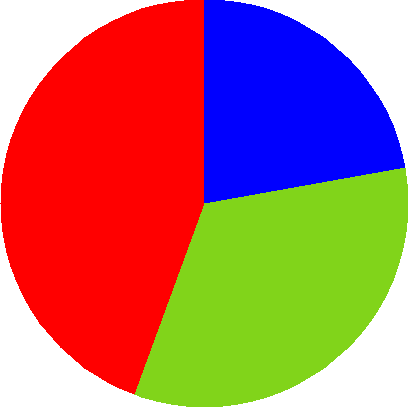
The actual alt text I used here was "Pie chart showing preference for red (44.44%), green (33.33%), and blue (22.22%) of a fictional group of 45 people". This works perfectly as a replacement for the image and conveys the meaning of the image.
Other technically correct but useless (because they aren't a good replacement to the image) alt text values could be:
- Circle coloured red, blue, and green
- Pie chart of favourite colours
- Image showing favourite colours
- Graphic of pie chart
- Favourite colours chart
To help get your alt text right, disable images in your browser. If things don't make much sense to you when you're reading through the content, then other people are going to struggle too.
Captions
Sometimes there might be additional information that you want to convey to your users that can't be put into the image or alt text, or doesn't make much sense. For example, a survey might have its raw results available, so a chart based on this raw data might want to include that link in a format that allows the user to copy and paste it for themselves. If the link is in the alt text, or is in the image itself, almost nobody can use it.
The caption doesn't have to just be a single line of text though, it could even be a small table of results that the graph was based on. For example, the previous colour preference graph could also include a small table of the values to make it easier for people to refer back to the details.
<figure>
  <img src="favourite-colours.png"
    alt="Pie chart showing preference for primary colours"/>

  <figcaption>
    <table>
      <caption>Favourite primary colours of 45 people asked in public</caption>
      <tr>
        <th>Colour</th><th>Number of Responsdants</th>
      </tr>
      <tr>
        <td>Red</td><td>20</td>
      </tr>
      <tr>
        <td>Green</td><td>15</td>
      </tr>
      <tr>
        <td>Blue</td><td>10</td>
      </tr>
    </table>
  </figcaption>
</figure>
You might have noticed here that I changed the alt text on the image for this example. This was to remove the redundant duplication of information, and here the information that the image is conveying has changed slightly because it's presented adjacent to the graph.
Long Descriptions
Sometimes, the information that you're conveying in a simple graph is just too much for a caption or alt text. When this occurs, you can fall back to the longdesc attribute of the <img> tag to link out to a page which can better describe in great detail exactly what the chart is meant to convey. For example, an infographic often conveys a lot of complex information in an easy to digest manner. Howver, a longdesc could be used to link out to a more verbose page of information.
It should be noted that support for longdesc is very low and then usually only with plugins or registry key changes. You might actually be better including the link in a caption for the image instead.
Graphs in Markup
Images are good for graphs, but they're not perfect. They look terrible when zoomed in, and it's very difficult to make them interactive in an accessible way.
The typical choices for creating graphs that are more accessible and allow zooming are to use either HTML or SVG. Obviously, the former is more simple, but that does limit the types of graphs and charts that can easily (and accessibly) be created.
HTML Graphs
HTML lends itself very well to bar graphs, being particularly blocky in nature. A good choice for the bar graph would be to use a
<figure>
  <figcaption>Preferred Operating System</figcaption>

  <ul>
    <li class="percent-50"><span>Windows (100)</span></li>
    <li class="percent-30"><span>Mac (60)</span></li>
    <li class="percent-20"><span>Linux (40)</span></li>
  </ul>
</figure>
To get that looking like a nice graph, we need a bit of CSS:
figure {
  border: 1px solid #000;
  padding: .5em;
}

ul {
  display: block;
  padding: 0;
}

li {
  background-color: #0070b0;
  box-sizing: border-box;
  display: block;
  margin-bottom: .5em;
  padding: .5em;
  white-space: pre;
}
li span {
  color: #fff;
  text-shadow:
    -1px -1px 1px #0070b0,
     1px -1px 1px #0070b0,
     1px 1px 1px #0070b0,
    -1px 1px 1px #0070b0;
}

li span::-moz-selection {
  background-color: #fff;
  color: #000;
  text-shadow: none;
}

li span::selection {
  background-color: #fff;
  color: #000;
  text-shadow: none;
}

/* use a preprocessor to generate all of these */
.percent-40 {
  width: 10%;
}
.percent-60 {
  width: 60%;
}
.percent-100 {
  width: 100%;
}
The main downside of doing it this way is that you can potentially end up with a lot of unused CSS classes cluttering up your style sheets. You might have noticed a text-shadow here which looks slightly out of place. This is to ensure that when a label extends beyond the width of its bar, it has an outline which can contrast against its background. This should be sufficient for most cases, but it might vary depending on the colours used. To counter the ugly effect when selecting text, I've removed the text shadow for selection using the ::selected pseudo selector. However, this appears to have some side-effects in Firefox as it removes the default background colour for the selected text too. To fix this, I've just specified an explicit background and foreground of black and white for the text when it's selected.
The end result is something like this:
- Windows (100)
- Mac (60)
- Linux (40)
All text in the graph is selectable, and screen readers are presented with a list of the full content of the chart. The chart takes well to zooming at any level, and is fully responsive.
SVG Graphs
HTML is good for very simple graphs, but when you need to do something a bit more complicated, like a line graph or pie chart, then SVG is your best option. While it is indeed possible to do a lot of complex work in HTML, it's not easy, and the result is often a cobbled together collection of hacks. An SVG will be more maintainable, can still be programmatically generated, and can often result in a lot less code.
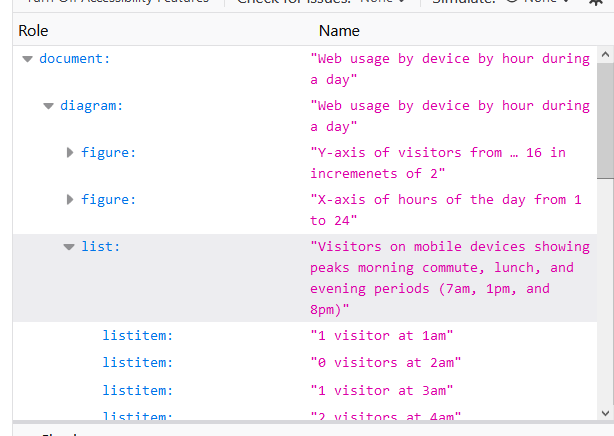
As an SVG is all just code, screen readers are able to interact with its inner elements, which means that you are able to make these charts and graphs more accessible by adding text nodes and labels where appropriate.
To make this more accessible, I've done a few different things:
- I've hidden all non-essential elements using
aria-hidden, like the light grey guidelines, as they don't need to be announced by a screen reader. - Added appropriate roles to elements within the SVG. For example, each line on the list has been given a
role="list", and each marker is given arole="listitem". This allows a screen reader to announce the graph lines as a series of items. - Elements are given appropriate labels; each axis is labelled with the range and step (if not 1), each marker has it's number of visitors and corresponding hour of the day, etc
If you inspect the graph in your browser you will see that the tree is populated with roles that are appropriate to the content.
I would have ideally liked to use some of the ARIA graphics roles for the bar chart (like graphics-xyplot), but unfortunately they're not supported by any browser I tested on, and given the age of the linked document, I don't think it likely we ever will see that support.
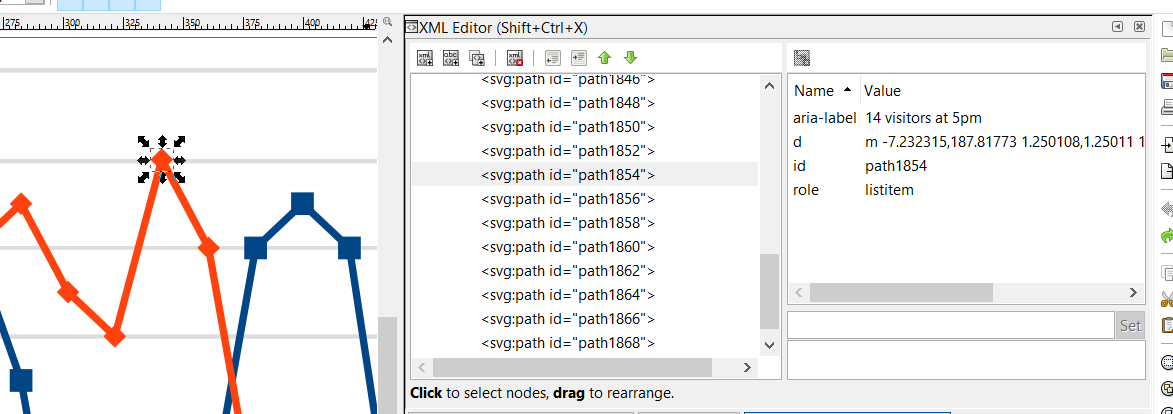
Making an SVG graph like this accessible can be a lot of manual work. When I was doing this one, I did have to make a lot of manual changes to the raw code, but there are plenty of applications out there that make this process easier. Inkscape has an XML editor that allows you to add custom ARIA and role attributes to nodes where required:
Using the Correct Type of Graph
Often, just using the right type of graph for the data you want to represent will give a massive boost to its accessibility. Charts and graphs shouldn't just be a raw dump of your data into some kind of visual form, you should understand what it is that you're trying to portray with your graph and pick a chart medium that meets that requirement.
Jami Oetting has written a great post to help pick the right visualisation for your data. She breaks it down into 5 simple questions which narrow down specifically what your choices are in terms of the correct chart type.
Using the wrong type of graph can mean that some people need a lot longer to understand them, which is against the very purpose of using a visual graph. Sometimes, if you already know and understand the data, it can be hard to step back and appreciate how your choice of graph will be perceived by someone who doesn't have your knowledge. If you can't put yourself into that frame of mind, ask someone else if they can understand what you're trying to convey with your chart. If they can't, try a different type to see if that aids their understanding.
Simplify Your Graphs
Further to selecting the right visual appearance of your data, you should also pay attention to the data you present. A graph shouldn't be just a dump of the raw data, it should try to convey the key information of the data in a more manageable form. Consider the following image of a pie chart. It shows the top 40 Linux distros as determined by website visits as listed by https://distrowatch.com.
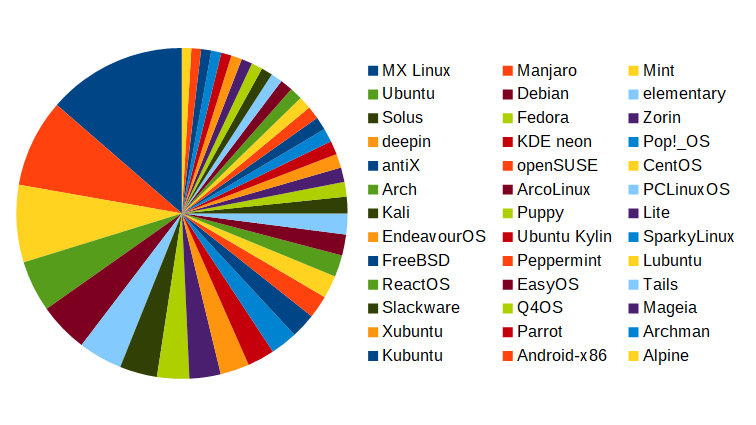
This is just a standard chart that Libre Office produces, and it has quite a few issues for use on the web:
- There are only 12 unique colours for the graph in a repeating pattern, making it very difficult for anyone to easily identify each segments label, and that assumes that they have no difficulties perceiving any colours
- Among the 12 unique colours, there's too much similarity. For those people who can't see colours at all, the chart is useless:

- There are 3 coluumns of labels, and it's not obvious what the order is if you struggle with colour perception.
- There's no percentage values anywhere, which presumes this data isn't available for a text equivalent of the chart too
- There are too many segments. Beyond the first few, the size difference between the rest is too small to discern, so the charts original purpose is lost
Instead, the chart could use better grouping on the base Linux distribution, and then further group the distributions that fall beneath a given percentage. The result is a much cleaner graph which briefly explains the top distros much better:
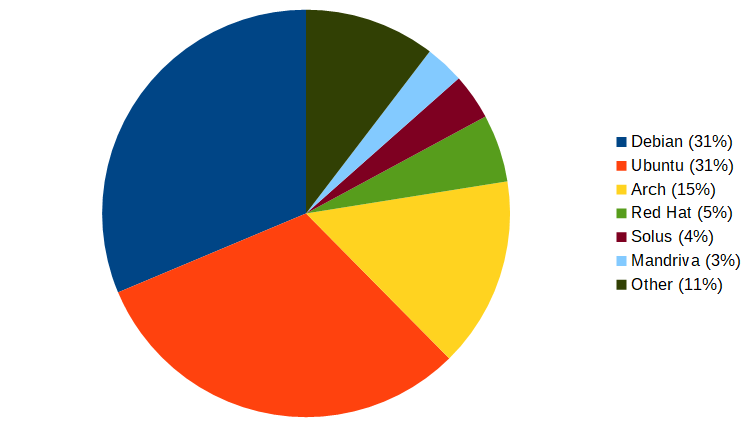
| Base Distro | Hits per Day as % |
|---|---|
| Debian | 31% |
| Ubuntu | 31% |
| Arch | 15% |
| Red Hat | 5% |
| Solus | 4% |
| Mandriva | 3% |
| Other | 11% |
When you're creating a graph or chart, consider the amount of information you're putting into it. point can be conveyed with less information, or from a simplified form, then consider doing that. It will benefit:
- Those people who have cognitive problems, which might make it difficult to understand more complex ideas.
- People who don't have a great grasp of the language. On the Web, your audience is the world, which spans many, many languages, and your visitors might only have a very basic grasp of your language, or they may be using an automatic translator to convert the content to their own language.
- People that might just be tired after a long day, or are currently in an environment full of distractions. These are types of temporary disabilities that can affect anyone. Recently, with Covid 19, many more of us have been put into situations of intense pressure with working from home whilst caring for children and other family members.
Don't Rely on Colour Alone
If there's one thing that tends to rely on colours to help convey meaning, it's charts. Colour is used as the way to link the key to the individual elements (be they pie slices, bars, or lines) on the graph. As most of us know, colour shouldn't be relied upon as the only way to convey information in a chart. There are many people who suffer from one of the various forms of colour blindness, and environmental conditions (like bright sunlight on a screen, or a night mode that lowers the screen brightness) can change the appearance of some colours.
Patterns
Consider the following image of a graph which shows tea and coffee purchases over the course of a week broken down by day:
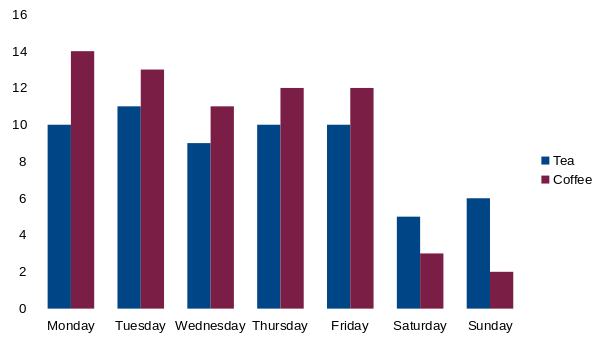
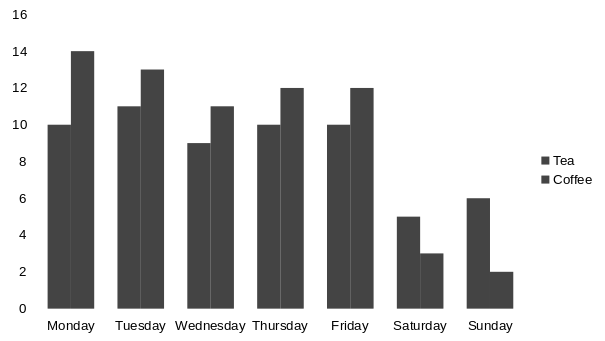
The graph is using dark blue and maroon for the bars, which don't contrast well at all. In fact, the light levels for both of those colours is virtually the same, which this greyscale version of the same graph shows:
A better version of the graph uses a pattern to distinguish the bars and not rely on colour alone:

Line Styles
A graph that relies on lines to indicate values doesn't have any fills, but you can vary the line (stroke) styles instead. Much like Morse code, you can use a series of gaps in the line to differentiate each line.
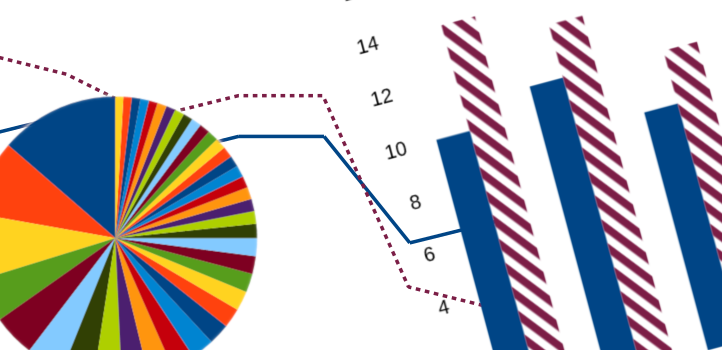
If we put the tea and coffee data into a line graph instead we can more easily illustrate to the viewer where purchases of one beverage overtakes the other.
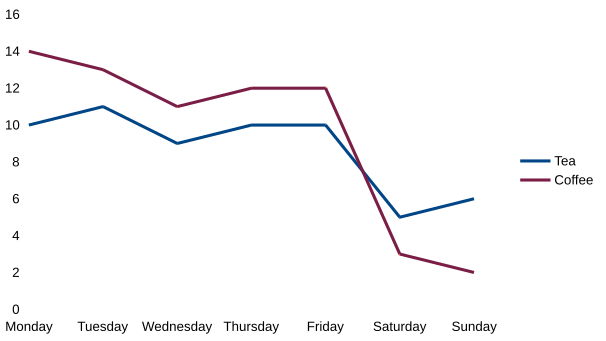
Again, we have the same dark blue and maroon combination, and with the colours removed, we end up with an unusable graph:

By adding a pattern to one of the lines, we make the graph far more clear and easy to read, and it's accessible without relying solely on the colours:

Markers
Scatter and plot graphs can also benefit from using different marker shapes. Try to make the markers as distinguishable as possible, such as using circles and triangles instead of squares and diamonds.
If the spacing allows, you could even consider using emoji as the markers if they're different enough. Some emoji can be read out by screen readers by their name. Some emoji that work great for this are vehicles and food.
Be cautious with this however, as not all emoji display visually the same way for all users. Try to pick ones that are very different from each other to avoid confusion. This will benefit those people who have blurred or low vision, and those in bad lighting conditions.
A Warning on Pattern Usage
There are still some concerns when using patterns on graphs, they are not a magical solution to fix everything. Bear these considerations in mind:
- Patterns should fully identify their edges. For example, a diagonal line pattern can work well to define edges if the lines are small enough, but a dotted pattern might not work to define the edge. The same dotted pattern could be fine for use in a pie chart, however.
- Avoid using too many patterns.
- It's difficult to make patterns different enough from each other, if you have too many, there is a higher chance of someone confusing them.
- Too many patterns can make the page visually "noisy", which can be distracting, especially if a person is prone to distractions.
- Keep patterns distinct. If you're using multiple patterns, try to keep them as varied and distinct as you can. For example, using a mix of squares and diamonds on a scatter graph could be confusing because the markers are too similar. Instead, you could change one set of markers to be a circle instead.
A Note on Animated Graphs
If you're animating a graph (for example, you want to show a trend of growth/shrinkage of social networks popularity over time) then it can be tempting to reach for a GIF. Animated GIFs are innaccessible for a lot of reasons; they don't allow the user to stop them, there's no option for proper timed captions, and there's no way to control their speed or pause them temporarily.
A better option would be to use a video, and supply captions or descriptions that are synchronised with the playback of the video. This can be done very easily using the Web Video Text Track (VTT) format. These captions can be added to your HTML5 videos using the <track> tag. By implementing them in this way, you give the control over to your users. This method also allows you to supply captions in a variety of languages, meaning you can open up the content to a much wider audience across the world.
Conclusion
Anything suitably complicated can be tricky to make accessible, and charts are no exception. Try and follow these steps:
- Keep the graphs as simple as you can
- Don't rely only on colour, use different shapes, fill, and line styles
- Use descriptive
altattribute text to describe images - Add a table of the data shown on the graph using a
<figcaption>if the data can't easily be conveyed using analtattribute - SVG graphs allow you to use
aria-*attributes, use of this feature where it makes sense
Comments