
Tags:
 Following on from my last coding article showing how to create animated glowing lines in canvas this was an attempt at creating a simple animated drawing of a basic line art shape with the same glowing line technique.
Because I wanted to be able to see the shape being drawn it had to be as a series of steps which could be broken down into manageable chunks. I also wanted the code to be flexible enough that I could change the shape it was drawing whenever I liked, without having to code up a complex series of steps each time. These two requirements got me thinking about the shorthand notation of a path used in SVG which uses single letters followed by one or more pairs of coordinates to draw lines and curves. Here's a simple example taken right from the XML Editor found in Inkscape (broken into separate lines to aid readability):
M 161.70443,272.07413
C 148.01517,240.84549 134.3259,209.61686 120.63664,178.38822
C 132.07442,172.84968 139.59482,171.3636 151.84309,171.76866
That's basically a moveTo command followed by two curveTo commands. The coordinate system is the same for both HTML5 Canvas and SVG, so all I needed was a basic parser to turn the SVG shorthand path into something I could use with Javascript.
As it turned out, that wasn't too difficult, and this is the result of that parser:
var path = "SVG path, as above example";
var highlight = new Array(0, 0, 255);
var current_point = next_point = 0;

$(document).ready(function(){

	canv = document.getElementById("drawing");
	if (!canv || !canv.getContext)
		return;
	context = canv.getContext("2d");

	context.fillStyle = "#000";
	context.fillRect(0, 0, canv.width, canv.height);

	animate_drawing()
});

function animate_drawing()
{
	var points = path.split(' ');
	var draw_part = {type:'m',buffer:new Array()};

	i = next_point;
	if(i >= points.length)
	{
		return false;
	}
	else
	{
		timer = window.setTimeout("animate_drawing()",25);
	}

	for(i=current_point; i<=next_point; i+=2)
	{
		draw_part.type=points[i].toLowerCase();
		draw_part.buffer.length=0;
		if(i>=2)
			draw_part.buffer.push(points[i-1].split(','));
		else
			draw_part.buffer.push(new Array(0,0));

		// i should be incremented by the number of coordinate pairs it has beyond the first
		// for example, a bezier curve has 3 pairs of coordinates; the two control points &
		// the end, so it's extra increment is 2 (as i pair of coordinates is always assumed)
		// also here, m does nothing, so we ignore i
		switch(draw_part.type)
		{
			case 'c':
			{
				// curveTo
				draw_part.buffer.push(points[i+1].split(','));
				draw_part.buffer.push(points[i+2].split(','));
				draw_part.buffer.push(points[i+3].split(','));
				i+=2;
				current_point = i;
				break;
			}
			case 'l':
			{
				//lineTo
				draw_part.buffer.push(points[i+1].split(','));
				current_point = i;
				break;
			}
			case 's':
			case 'q':
			{
				// smooth curveTo
				draw_part.buffer.push(points[i+1].split(','));
				draw_part.buffer.push(points[i+2].split(','));
				i+=1;
				current_point = i;
			}
			default:
			{}
		}

		draw_output(draw_part);
	}

	next_point = i;
}
This processes the string (copied straight out of the SVG source for a curved line) and uses a timeout to draw it a bit at a time. First, the string is broken into instructions based on the space character. Luckily, Inkscape keeps coordinate pairs together without using a separating space, so that works in our favour here. The code then checks the current point (which should be a letter as the path should start with a moveTo command), reads ahead the right number of coordinate pairs for that instruction, and then increments the next_point variable so that it doesn't attempt to redraw parts of the image it has drawn already (I tried this the first time, by redrawing the entire canvas each time, but this was incredibly slow on Safari on the desktop and mobile so I ditched the idea.)
The actual drawing is handled with this function, which uses the canvas context we defined above and draws out the line that is stored in the buffer array:
function draw_output(draw_obj)
{
	for(j=5; j>=0; j--)
	{
		context.beginPath();
		context.lineCap='butt';
		context.lineWidth = (j+1)*4+10;

		// stroke the last line as solid white to get the glow effect
		if(j==0)
		{
			context.strokeStyle = '#fff';
			context.lineWidth = 2;
		}
		else
			context.strokeStyle = 'rgba('+highlight[0]+','+highlight[1]+','+highlight[2]+',0.1)';

		context.moveTo(draw_obj.buffer[0][0], draw_obj.buffer[0][1]);

		switch(draw_obj.type)
		{
			case 'c':
			{
				context.bezierCurveTo(draw_obj.buffer[1][0],draw_obj.buffer[1][1], draw_obj.buffer[2][0],draw_obj.buffer[2][1], draw_obj.buffer[3][0],draw_obj.buffer[3][1]);
				break;
			}
			case 'l':
			{
				context.lineTo(draw_obj.buffer[1][0],draw_obj.buffer[1][1]);
				break;
			}
			case 's':
			case 'q':
			{
				context.quadraticCurveTo(draw_obj.buffer[1][0],draw_obj.buffer[1][1], draw_obj.buffer[2][0],draw_obj.buffer[2][1]);
				break;
			}
		}
		context.stroke();
		context.closePath();
	}
}
This receives the draw_objvariable, which contains the type of drawing instruction and the coordinate buffer array, and uses a switch to determing how to treat those coordinates. I use the same technique as the animated glowing lines in canvas tutorial to give the appearance of a glowing line by drawing several semi-transparent lines in reducing thicknesses with a set colour and a thin white line on-top.
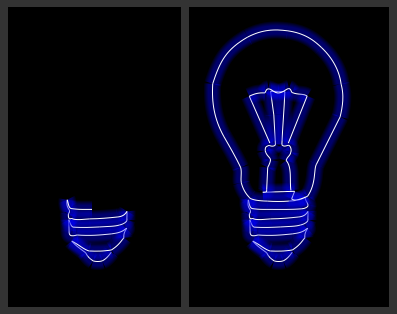
The final result isn't perfect. For example, where lines join there are some artefacts because of transparent lines being drawn on other transparent lines, and the crossover parts create darker lines. This is reduced by changing the lineCap to 'butt', but you can get some interesting results with 'square' and 'circle' too. To reduce the effect further, I use CSS to reduce the size of the canvas by half. This makes the whole drawing neater whilst still being legible.
For those itnerested, this was the original SVG drawing that I used the path from. I just grabbed an image of a lightbulb from the Open Clip Art library and drew over it with two lines which I converted to curves, then I just copied both of those into the path string remembering to include a space between each part.
Comments